You probably have the basics of Spotlight down already, but there’s far more handy features you can utilise to enhance your productivity. We asked Matt our new support specialist based in the UK, to answer some frequently asked questions..
1. How do I consolidate interdepartmental spending?
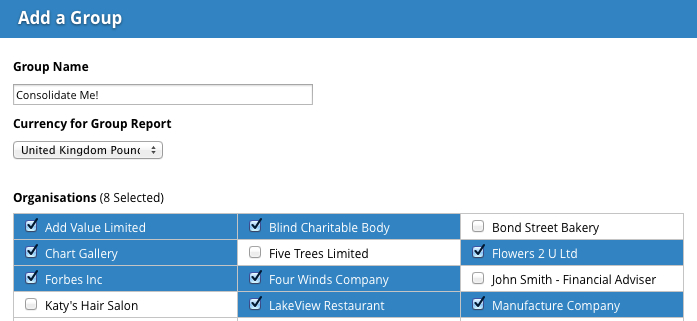
Utilising importing Excel Spreadsheets will help you with this. It’s a great feature for many reasons including importing a standard chart of accounts into Spotlight to get things going, even with no data having been entered into the spreadsheet. If you were to download our Excel template and then import it having made no changes to it, then you have a whole host of headings under customise data that you wouldn’t have there otherwise. This is particularly useful for those who are doing group consolidations and have created an organisation for the sole purpose of eliminations. For example, interdepartmental spending between companies can be amended to show a zero figure in the group report, where you can manually enter this data to be used in Spotlight. There is a video that goes in depth about this that you can take a look at here.
2. How do I overwrite or amend data in Spotlight?
With the Excel import you can overwrite data in Spotlight if amendments need to be made rather than having to manually edit it, which would be time consuming. Using our Excel template, you can enter the figures you want to overwrite for whatever data type, you then can amend the import date in Spotlight when choosing the saved file to import which will bring in the new figures and overwrite the old for that period of time. Just ensure that ensuring the date is formatted correctly (for e.g. Jan-14) and also make sure that you are importing the correct date range for your amendments otherwise you might inadvertently overwrite data that you had not intended to remove. If you want to learn more about our Excel template, you can take a look here where we go more indepth.
3. Do I have to keep importing categories?
Another useful feature of the Excel import is that you can import 'account type' categories initially and you will not have to import these categories again as they will be saved in Spotlight for future use. This is great if you’re doing month on month imports of say your balance sheet from an accounting program for that particular organisation. The tab at the bottom of your Excel spreadsheet needs to be renamed as either ‘actuals’ or ‘budget’ depending on the data being entered. Spotlight will automatically point out this error if the import has failed. If you’re interested in details on the categories you can list to import, you can find out more here: If you want a summary of the format of using your own spreadsheet check this out.
Tip: Spreadsheets have to be saved in the .xlsx format to import into Spotlight. When you have imported a spreadsheet, make sure you select from the drop down box the source of your data when in the 'customise data' screen to view the Excel data in Spotlight. This applies to the above three points.
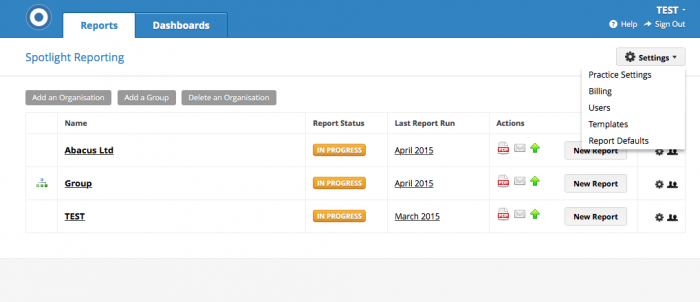
4. I’ve customised my Report or Dashboard, do I have to do that everytime I want to send one out?
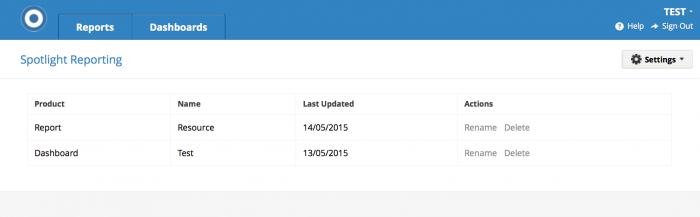
There is no reason for having to recreate the layout, titles, formats, charts and the way information is displayed in Spotlight every time you want to create a report or dashboard. When you have everything just the way you like it, you’re able to save this as a template. A template is a great way to establish continuity of information that is both useful and relevant to your individual organisations and also consistency throughout your organisation for your clients. The template can be named accordingly and used across all of your organisations that you have setup in Spotlight Reporting. You can manage your templates in the settings on the main page of your Spotlight account, if you need to rename or delete them you can do so from here as well like in the screenshots below:
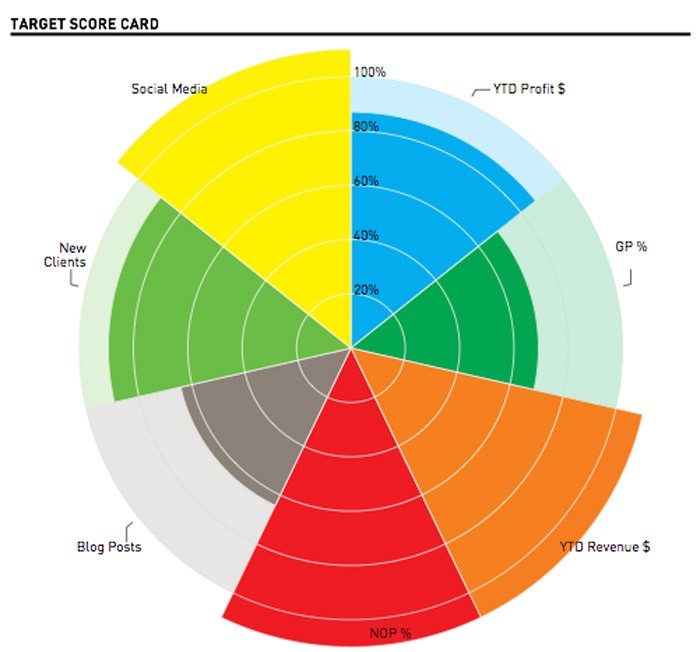
5. Can I set targets with my clients and be able to visualise their performance?
The KPI target score card is a very useful summary you can display in your report or dashboard that allows you to measure financial performance against the non-financial data most pertinent to that client. Spotlight automatically calculates the various sections as a default, all you need to do is add the target data. You can add the targets for these under ‘customise data’ and ‘KPI/targets’. To add your target data, you can 'add account' to add your own customised KPI categories and manually edit the actual and target details for each category you've created. This allows you to easily visually the holistic performance of the business and what areas of the business are affecting the financial performance. You can even customise the chart to change the date range and also add and remove KPI categories from being displayed on the scorecard.
To check out how you can get started and have this chart feature in your report click here.