There’s always a story behind the numbers. Bring them to life quickly with our new and improved Chart Gallery in Spotlight Reporting. Read on to find out more.
Storytelling with data
A good chart tells a story. It removes the noise from the data and highlights useful information. Choose the right chart and you’ll be ready to deliver accurate insights to your clients.
Spotlight Reporting is home to more than one hundred charts with templating, customisation and white-labelling options. From visualising cash-ins & outs to stock-on-hand and even personal wealth, there’s a chart to bring the data to life – and now it's even easier to find with a new and improved Chart Gallery.
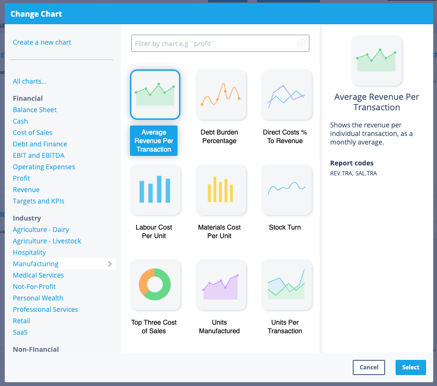
A fresh look for your Chart Gallery
We hope the new design speaks for itself, but here are some answers to questions you might have about the new look.
Why the change?
Being able to easily find the chart that provides the right canvas for your analysis is key. We wanted to improve the process of finding a chart, so we set about reorganising and redesigning the Chart Gallery to speak more clearly to the way you work.
What’s different about the new chart gallery?
A few things!
- Finding your chart is now faster with a new search function.
- We organised each chart into categories, and now you can quickly find the chart you need – whether it’s a industry-specific, financial or non-financial chart.
- Easily learn what each chart does with chart descriptions.

Take a look through our help articles if you need help getting started.
All in all, our new Chart Gallery is incredibly flexible and allows us a lot of room to grow into it. We’re really excited to launch it today and watch it grow and continue to make Spotlight Reporting be the best it can be for our subscribers!
Good or bad, we’d love to hear your feedback, so please email customer@spotlightreporting.com.