
At Spotlight Reporting our technology offers accountants and financial advisors the opportunity to create easy, great-looking performance reports, helping them become trusted advisors to their clients or within their workplace. We enable accountants and financial advisors to shift from having to do numerous hours of manual data entry and analysis, to being able to easily import their data from multiple financial platforms and create reports on behalf of their clients or workplace. Spotlight Reporting can encompass anything from forecasts, profit and loss analysis and financial KPI’s.
What a lot of people don’t realise is that our tools encompass non-financial KPI’s too. We import data directly from Google Analytics, WorkflowMax and via CSV/EXCEL from other systems so that you have non-financial data-sets alongside core financial data. This mash-up helps business owners look at the business holistically and pinpoint what can be done to grow, measure and achieve success.
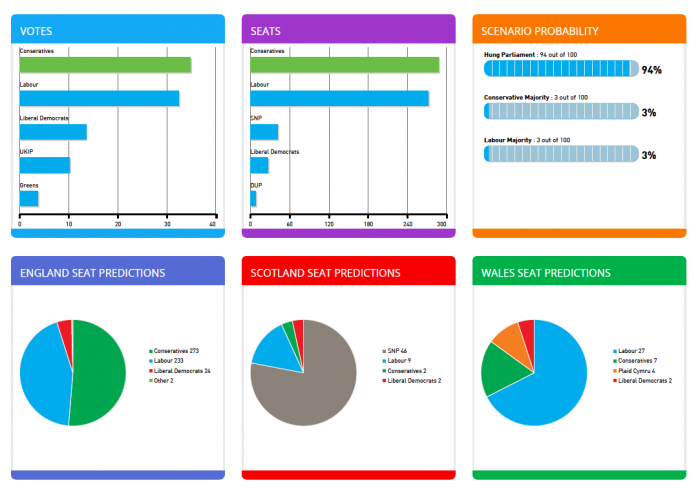
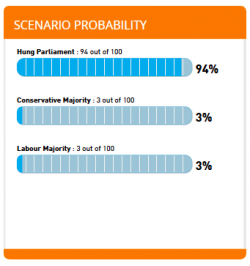
To illustrate the flexibility of the non-financial data you can visualise and report on, we’ve created a Spotlight Dashboard on the current predictions for the UK General Election this year. You can easily see and understand from the visual data representations, what the predictions are. For example the outcome scenario probability of a hung parliament is easily understood below.
Furthermore, our one-page display allows you to see an overall makeup of the information and how KPI’s correlate to each other. Just as people don’t want to wade through a blizzard of numbers to understand the predictions for the upcoming UK election, business owners don’t want to wade through unclear accounting reports to understand what’s going on in their business either.
Being able to present a full report or dashboard encompassing all of the key performance elements of the business allows the accountant or financial advisor to focus on providing insight and support, making themselves essential to their clients or organisation.
If you’d like to talk to us more about what financial and non-financial data you can visualise, we’re currently on the Xero Roadshow in the UK and will of course be at Xerocon in New Zealand as well. Come by and have a chat! Our recent Dashboard release video can be viewed here, giving you a clear idea of our three Dashboard report options.